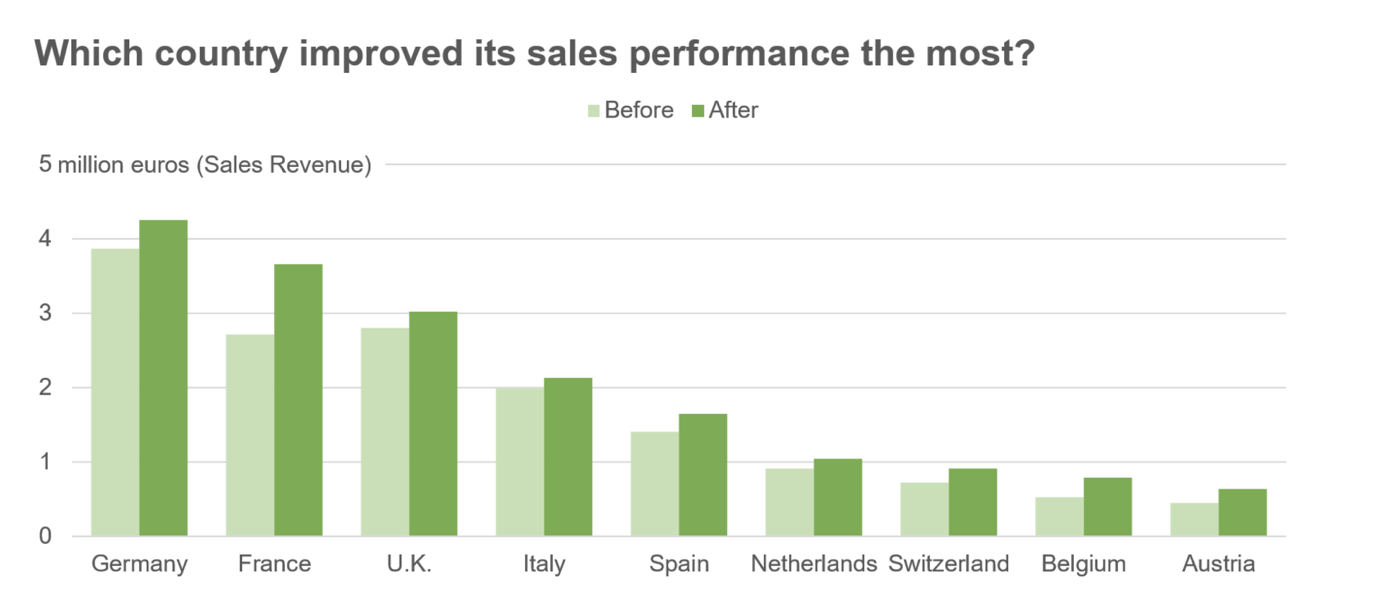
Slope charts are often suggested as a valid alternative to clustered bar charts, especially for “before and after” cases.
So, instead of a clustered bar char like this
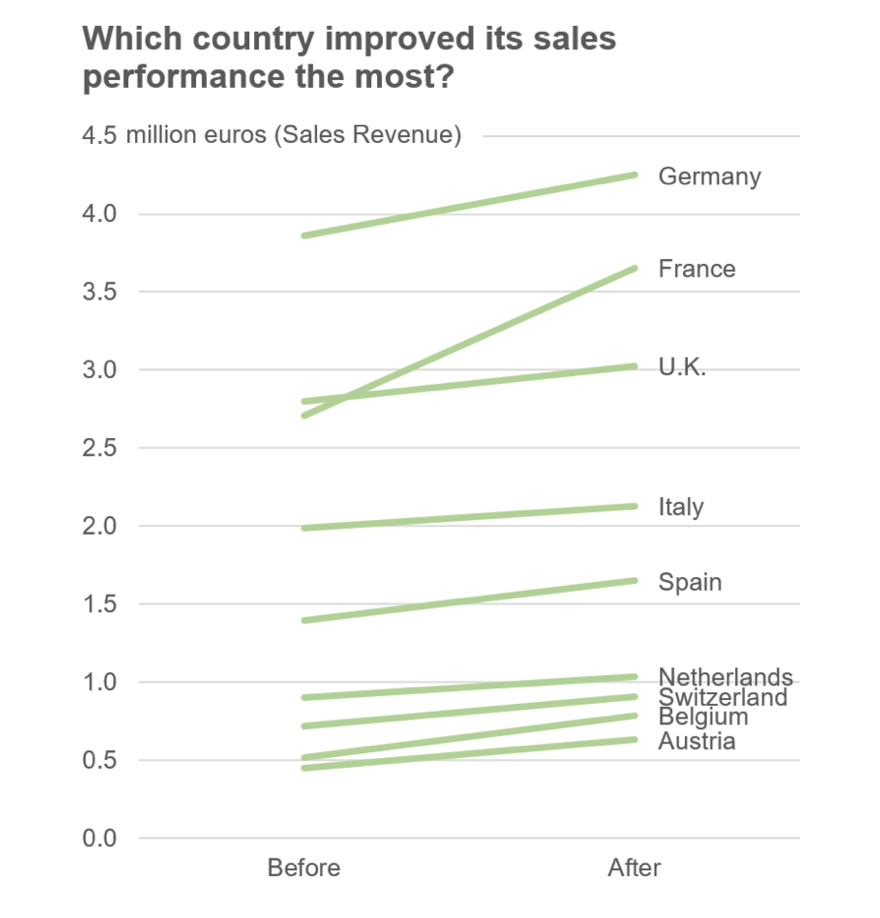
we tend to recommend a slope chart (or slope graph) like this
However, a slope chart isn’t free of problems either. In the past, I already wrote about a case of a meaningless slopegraph [here]. Today, I stumbled upon an interesting blog post (and a video) that surveys the problems of slope chars and their alternatives
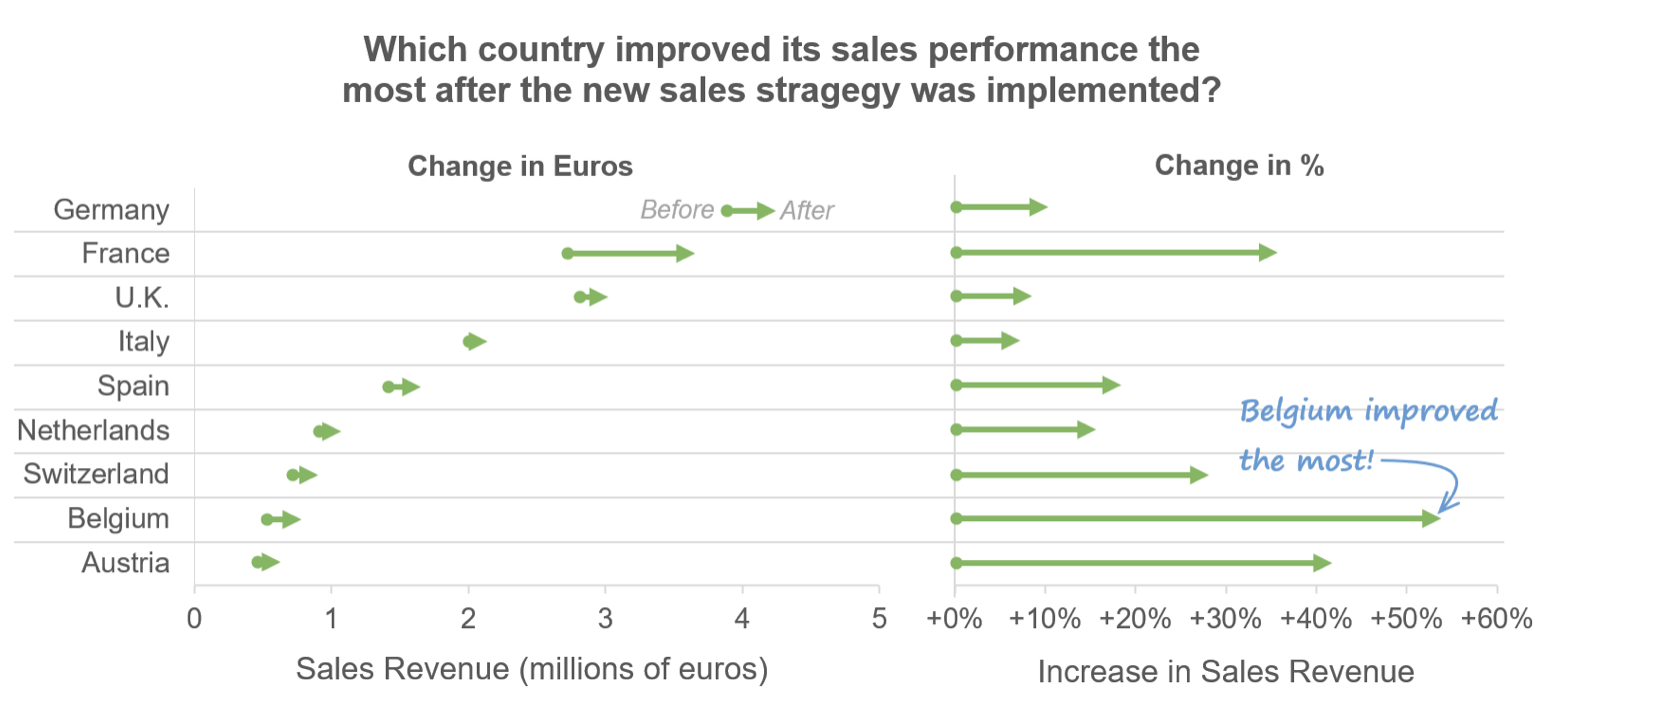
All the graphs here come from the original post by Nick Desbarats that can be found [here].