I stumbled upon a great graph that tells a complex story compellingly.
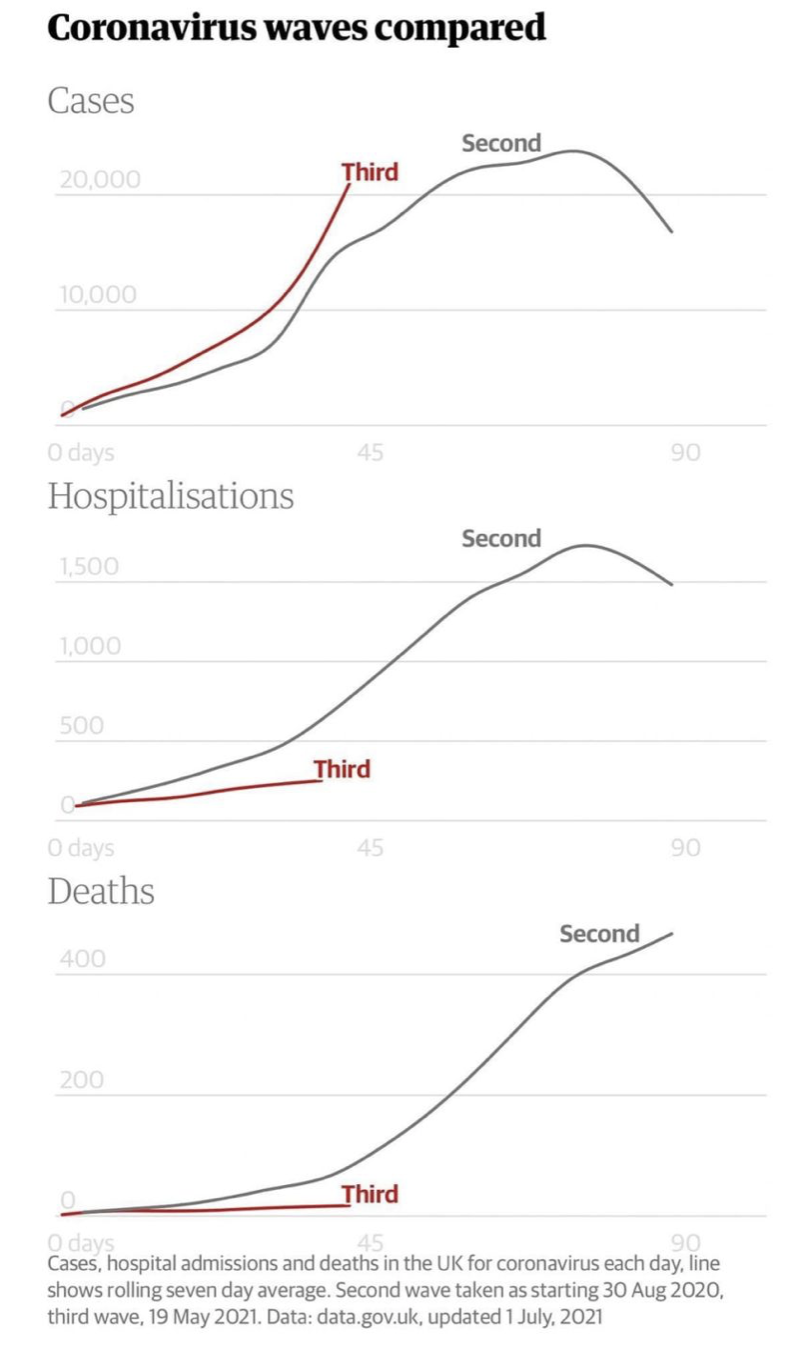 Comparison of two COVID-19 waves in the UK, taken from here.
This graph compares the last two waves of COVID-19 in the United Kingdom and is shows so clearly that the new wave (that is supposedly composed of the Delta variant) is much more infections on the one hand, but on the other hand, causes much less damage. Is the more moderate damage the result of the Delta variant nature of the protective effect of the vaccination is still an open question, but the difference is still striking.