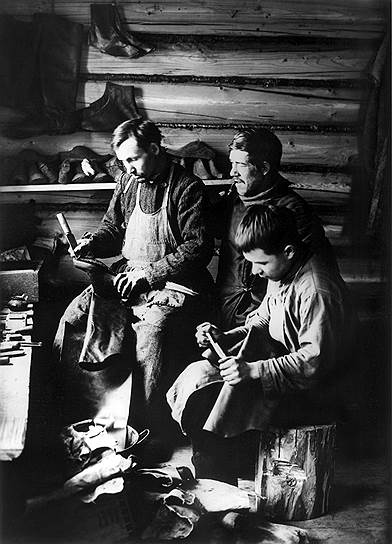
When I was in elementary school (back in the USSR of the mid 80’s), I had a friend whose father was a shoemaker. Due to the crazy stupid way the Soviet economy worked, a Soviet shoemaker was much richer than a physician or an engineer. But this is not the story. The story is that one day this friend’s father had a chat with me about selecting a profession. This man’s point was that for as long as people have feet and need shoes on their feet, a shoemaker would be required and well-earning occupation. Guess what? People still have feet, and still, ware shoes, but I don’t see too many successful shoemakers anymore.
Common wisdom says, “It is very hard to predict, especially the future.” And I will add “even more especially, about the job market.”. Nevertheless, people need to decide what to do with their lives, how to live, and what career paths to pursue. Some of them ask me, and I’m glad to answer. If you have any career-related questions, don’t be shy! Write to boris@gorelik.net, and I’ll see what wisdom I will be able to share with you.
Anyhow, this is a letter that I got from another pharmacist looking for a data science career.
Hope you are doing well. I saw your posts on Quora and thought of asking a doubt.
First let me tell my background. I am from India, I completed my Doctor of Pharmacy program (Pharm D). I am familiar with computer programming. I have intermediate knowledge in python and R programming. So I thought taking up Bioinformatics and computational biology Masters program so that I can connect Pharma industry and my knowledge in computer science.
What do you think?
I have applied to University XYZ and got offer letter. I have to take a decision within 2 weeks.
Please let me know your thoughts on this.
To which I replied
Obviously, since the path you are describing similar to the one I took, I will think that it is a good idea. Moreover, as you might have read in my blog (for example, here), my opinion is that advanced degrees give much more stable foundations, compared to the “fast and easy” courses. Having said that, your life is yours, not mine, and the job market today is not the job market in 2001 when I graduated my B.Pharm.
Thank you so much for replying to my silly question. I am honoured to get a response from you.
First of all, I don’t believe in “there are no silly questions” bullshit, but asking a silly question is better than not asking at all. Secondly, these questions are not silly at all.
I have a question, in your post dated 2017, you have mentioned that Bioinformatics was booming in 2001 and now it has lost its significance. Are you still have the same thoughts?
I think that this person refers to the most visited post of mine “Don’t study data science as a career move; you’ll waste your time!”. There is also a 2019 follow-up.
If that is the case then me taking a master’s in bioinformatics and computational genomics would be a bad idea, right ?
Here’s what I responded. Keep in mind that I wrote this before the COVID-19 outbreak.
Look, the markets in different countries are different.
Back in the old days, there was a worldwide wave of closing bioinfo companies. All the Israeli ones were either closing or counting weeks before closing. One anecdote: I was interviewing at a company. Two weeks later, I called the person who interviewed me to ask whether I got the job or not, and the secretary told me that that person was fired due to layoffs.
Right now, Israel sees a renaissance of bioinformatics companies, but I don’t know what will happen in the future. These companies live mostly out of investors’ money and are subject to strict regulations. However, if you get a good education, your head will be full of useful mental models, relevant basic knowledge, and good practices.
End of quote. One of The COVID-19 madness side effects is the massive influx of money into biotech companies. Is this a short-term anecdote, or will it become a sustainable trend? I have no idea.
Do you have any career-related questions to me? You don’t have to be a pharmacist to ask :-). Write to boris@gorelik.net. I promise to respond, even if by sending a link to my blog posts.


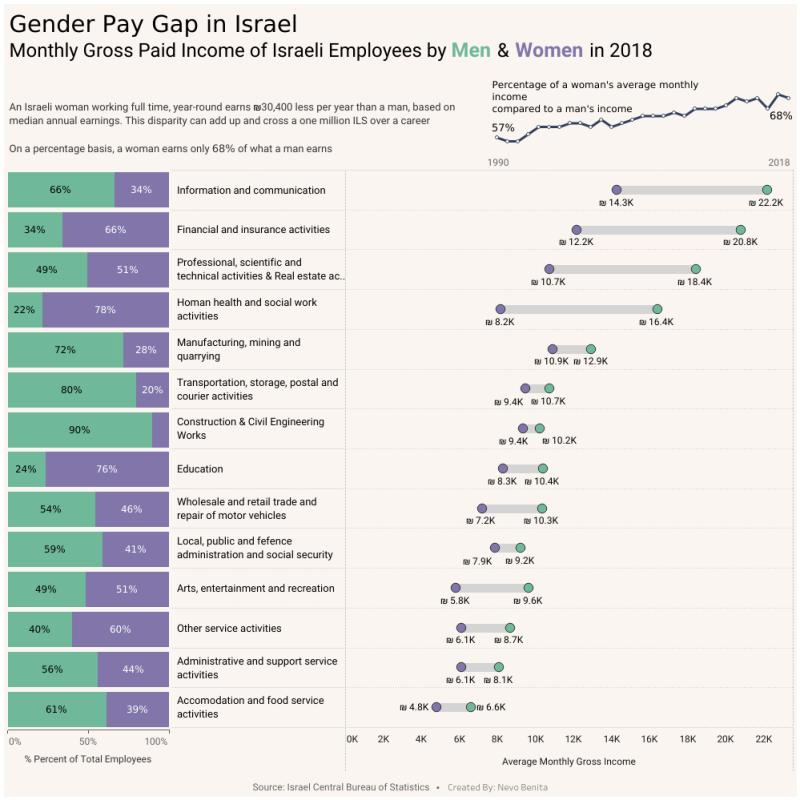
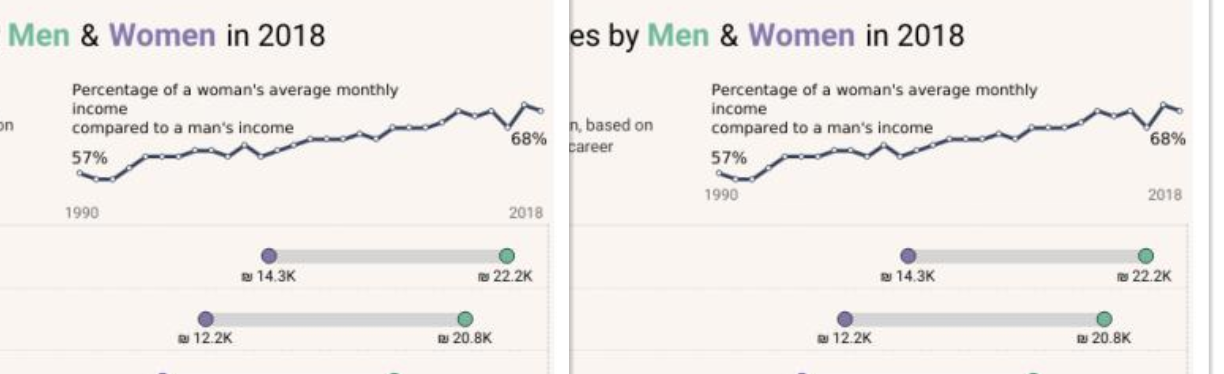 *Now, it is more clear that “1990” and “2018” relate to the time-series graph above.
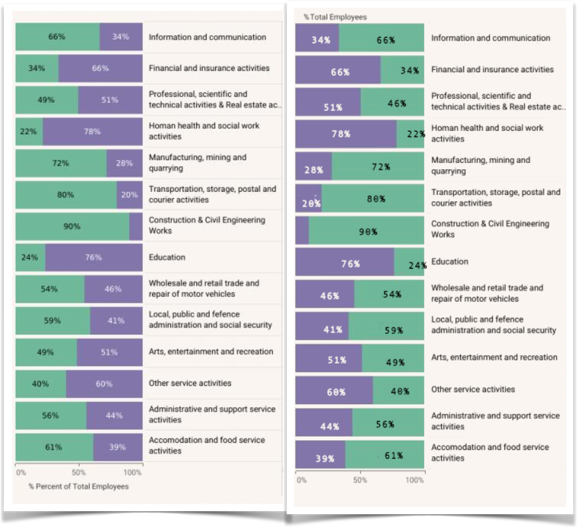 Moving the explanation to the top makes it easier to notice. Before (left) and after (right)
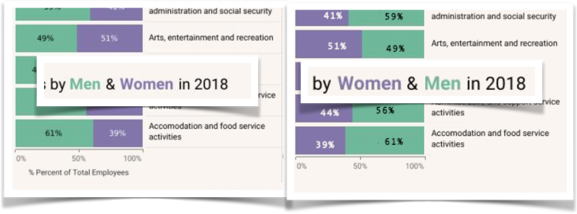 Keeping the color order. Before (left) and after (right)
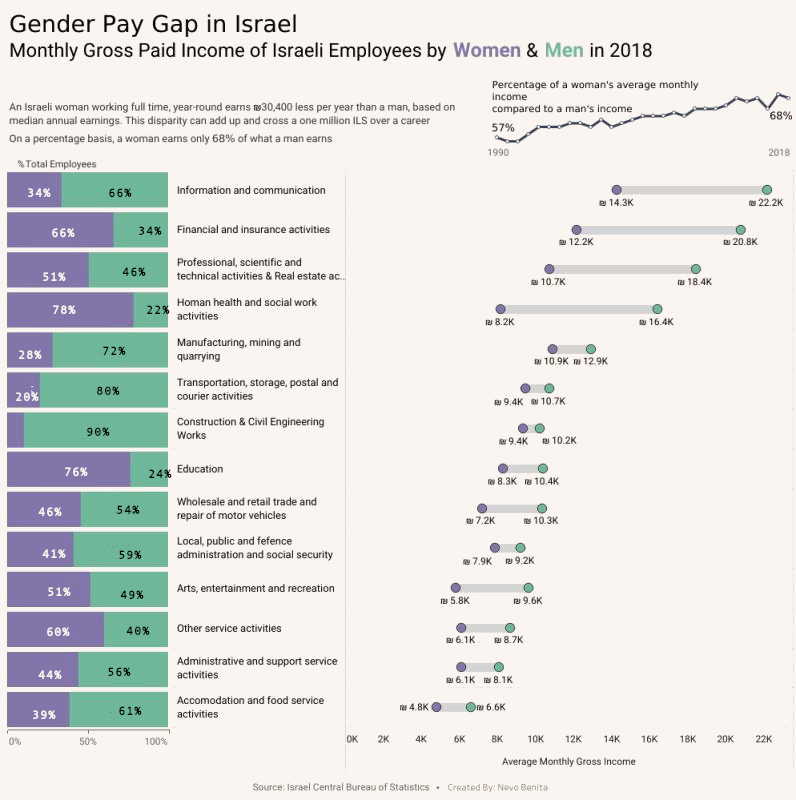


 Slight feeling of a hamster-wheel while reading this book